Pi System Align
Welcome
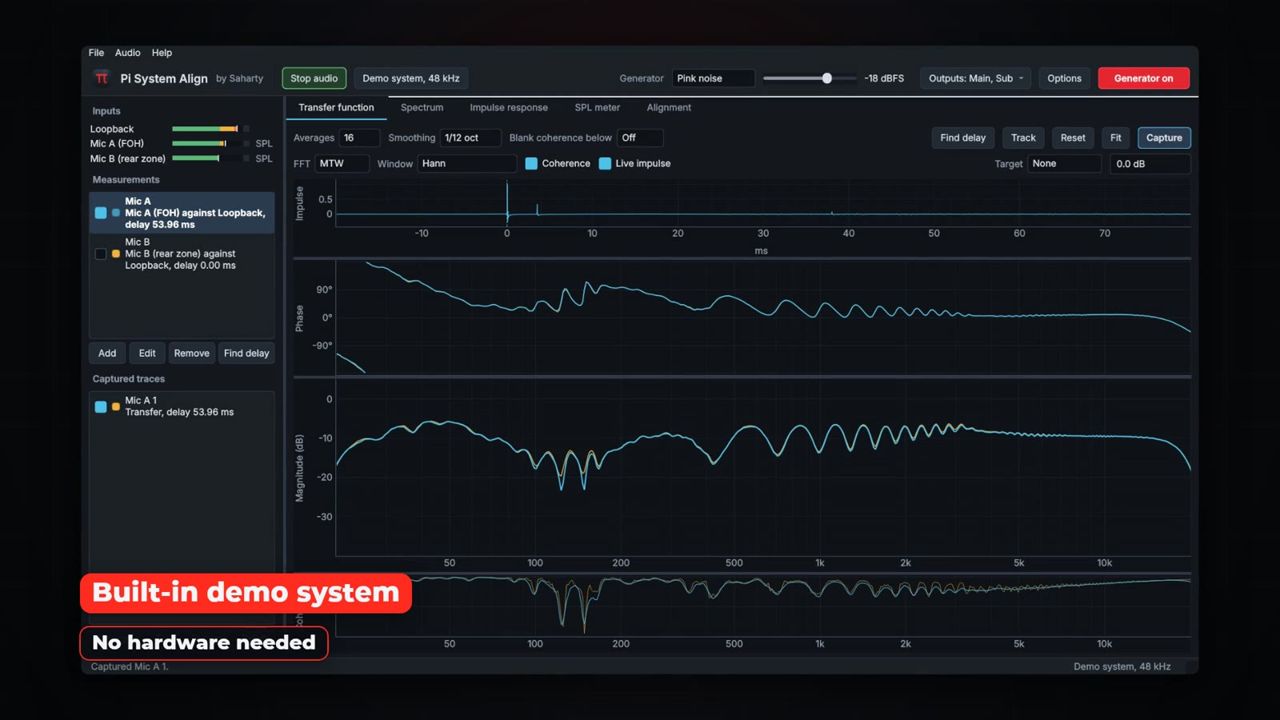
Pi System Align by Saharty is a dual-channel measurement and alignment application for sound systems, for macOS and Windows. It measures your PA the way a system engineer does: it compares the signal you send to the system (the reference) with what a measurement microphone hears in the room. Then it tells you what to change. It shows you where to put the microphone, what delay to set, whether to flip polarity and when an all-pass filter will help, so your loudspeakers add up instead of fighting each other.
Everything you need to tune a system is in one window:
- Transfer function: multi-time-window dual-channel FFT with magnitude, phase, coherence and a live impulse, plus averaging, smoothing, coherence blanking, delay tracking and target curves.
- Spectrum: a real-time analyser from 1/1 to 1/48 octave with A, C or Z weighting, peak hold, bars and a spectrograph.
- Impulse response: log-sweep or live-signal measurement with EDT, T20, T30, C50, C80, D50 and Ts per octave, plus WAV import and export.
- SPL meter: A, C and Z weighted Fast, Slow and Leq readings, maxima, peaks, 1, 10 and 15 minute Leq values and a per-second log.
- Alignment: a mic placement assistant, crossover alignment, an arrival-time planner and a delay calculator with end-fire and gradient (cardioid) sub tools.
- Demo system: a virtual PA with a main system, a sub and a delay tower in a room, measured by two virtual microphones. You can learn every feature without an audio interface.
Who it is for. Pi System Align is for live sound engineers, system techs, installers and studio engineers who want measurements they can trust and clear advice they can act on. You don't need any measurement experience: the built-in demo system and the placement assistant walk you through the method step by step.
Version 1.1.0. This manual covers version 1.1.0, the current release. It includes all of the tools listed above, the built-in demo system and Pi by Saharty licensing, with online and offline activation and a 15-day free trial.
Quick start
Follow these steps to get from installation to your first aligned measurement. Steps 3 to 7 use the built-in demo system, so you don't need an interface yet.
- Install Pi System Align from the
.dmg(Mac) or the.exeinstaller (Windows). See Installation. - Start the app. On first launch the licence window opens. Press Start 15-day free trial, or enter your licence key and press Activate.
- On first launch the Demo system (built-in) starts by itself. If audio is stopped, press Start audio in the command bar.
- Press G (or click Generator off) to turn on the pink noise generator.
- Press D to find the delay of the active measurement (Mic A). The status bar shows the delay that was found and how far the arrival stands above the noise.
- Look at the Transfer function tab: the magnitude, phase and coherence traces settle as the averages build up. Press Space to capture a trace.
- Open Alignment > Crossover alignment, choose two sources and press Analyse. Then press Apply to demo system and measure again to hear and see the improvement.
- When you're ready for a real system, open Audio settings, choose your interface, wire a loopback reference and connect your measurement mic. See Connecting a real system.
Tip: Press Ctrl+1 to Ctrl+5 (Cmd on a Mac) to jump between the five views.
Installation
macOS
- Download the installer for your Mac from your account at pi-ware.com. There is one
.dmgfor Apple silicon and one for Intel Macs. - Open the
.dmgand drag Pi System Align to the Applications folder. - Start the app from Applications. The app is signed with the Saharty Developer ID and notarized by Apple, so it opens like any other app.
- When macOS asks for microphone access, choose Allow. macOS grants audio input this way, so without it the app receives no input signal.
Note: If you declined microphone access by mistake, open System Settings > Privacy & Security > Microphone and switch on Pi System Align.
Windows
- Download the Windows installer (
.exe) from your account at pi-ware.com. - Run the installer and follow the steps. It shows the licence agreement first.
- If Windows SmartScreen appears, choose More info, then Run anyway.
- Start Pi System Align from the Start menu.
On Windows, Pi System Align enables ASIO automatically. ASIO drivers are listed next to the WASAPI devices in Audio settings.
First launch
When you start Pi System Align for the first time:
- The licence window opens once, so you can activate or start the free trial.
- Audio starts on the Demo system (built-in), and the status bar says: "The demo system is running. Turn on the generator (G) to start measuring."
- The Alignment > Mic placement page already holds a typical show (mains, subs, front fills, out fills and delays) sized for a 30 m by 24 m room.
Pi System Align remembers its settings automatically: your audio device, channels, measurements, view settings, window layout and placement plan are restored the next time you open it.
Activation & licensing
Pi System Align uses the Pi by Saharty licensing system. A licence is a one-time purchase with free updates.
Getting a licence
Buy Pi System Align at pi-ware.com/products/pi-system-align. Your licence key arrives by email after purchase. It looks like XXXXX-XXXXX-XXXXX-XXXXX.
The licence window
Open the licence window from Help > Licence..., or click the coloured banner at the top of the main window. It contains:
| Control | What it does |
|---|---|
| Licence key | Paste or type your licence key here. |
| Activate | Activates this computer online with the key you entered. |
| Start 15-day free trial | Starts the full-featured free trial. You don't need any payment details. |
| Deactivate this computer | Frees this computer so the licence can be activated on another one. |
| Offline activation | Shows the request code for activating a computer that has no internet connection. |
| Copy code | Copies the offline request code. |
| Load licence file... | Loads the licence file (.pilic) you got from the website. |
| Buy a licence | Opens the product page. |
Online activation
- Open Help > Licence....
- Paste your key into Licence key and press Activate (or press Enter).
- The status line reads "Activated … Every feature is on."
Free trial
Press Start 15-day free trial. Every feature works during the trial, and the banner at the top of the window shows the days that are left.
Offline activation
If the measurement computer never goes online:
- Enter your licence key in the licence window.
- Click Offline activation. A request code appears.
- Press Copy code, and move the code to any device that has internet access, for example on a USB stick or in a message to yourself.
- Paste the code at pi-ware.com/activate. You receive a licence file.
- Bring the file back and press Load licence file....
Moving to a new computer
One licence activates one computer.
- From the old computer: open the licence window and press Deactivate this computer, then activate on the new one.
- If the old computer is not available: activate on the new computer anyway. Pi System Align tells you the key is active on another computer and offers Move it here. The other computer gets a notice.
- From your account: you can deactivate computers or reset machines from your account at pi-ware.com/account.
How the licence check works
- The app checks the licence whenever it finds an internet connection: at launch, then every hour, and every 2 minutes while offline. It keeps working offline with no time limit.
- 24-hour rule: nothing is ever limited without at least 24 hours of notice on that computer. This applies when a licence is moved, a trial ends, a refund is made or a computer is deactivated from the account. During the notice every feature works, and an amber banner shows the message and the countdown.
Limited mode
If the app has never been activated, or the notice has run out, Pi System Align runs in limited mode. A red banner explains the situation. Everything can still be opened, measured and viewed: audio, the generator, the transfer function, spectrum, impulse response, SPL meter, alignment tools, sessions and imports. Saving and exporting are turned off. This covers saving sessions, trace CSV export, impulse response WAV export, the SPL log and the mic placement plan. These buttons and menu items read Activate to save and open the licence window.
Note: Pi System Align never quits and never stops a running measurement because of the licence. Your show is safe.
The licence file is stored here:
- Mac:
~/Library/Application Support/Pi by Saharty/Licences/pi-system-align.pilic - Windows:
%APPDATA%\Pi by Saharty\Licences\pi-system-align.pilic
Interface tour
The main window has five areas: the licence banner (shown only when needed), the command bar, the sidebar on the left, the analysis tabs in the centre and the status bar at the bottom.
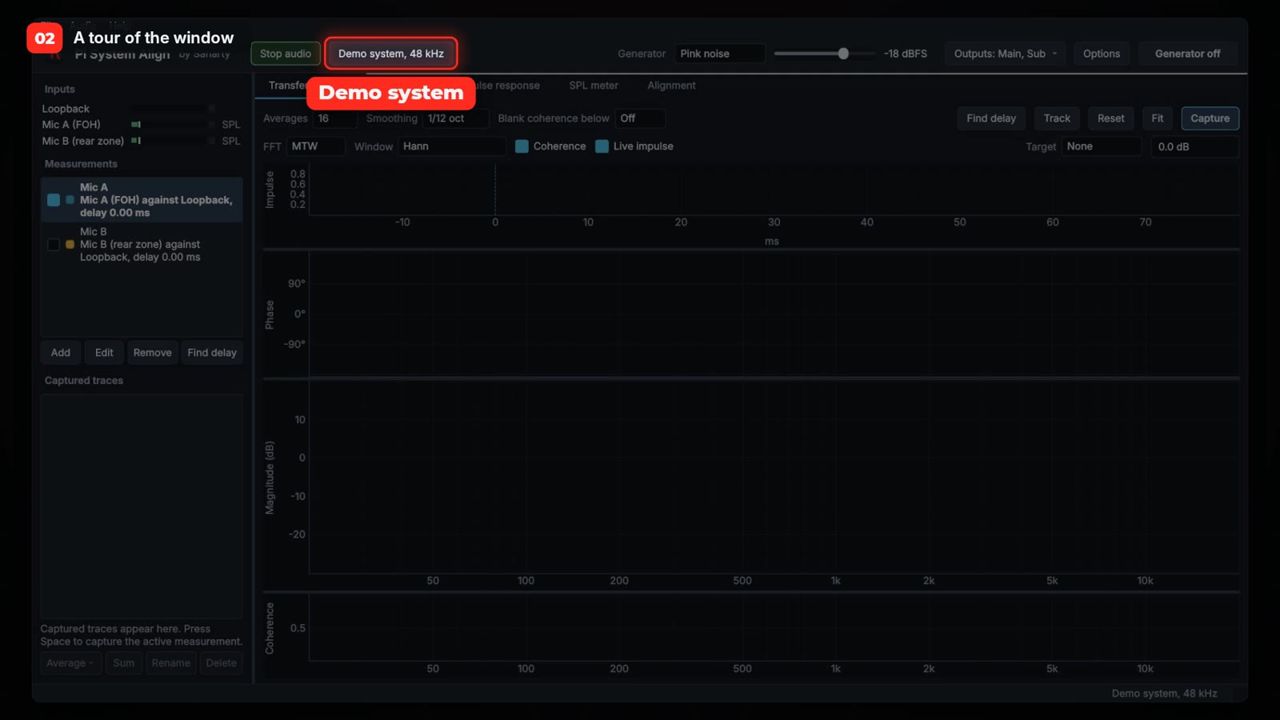
Command bar
The command bar runs across the top. It holds the audio controls and the signal generator.
| Control | What it does | Range/default |
|---|---|---|
| Start audio / Stop audio | Starts or stops audio input and output. | — |
| Audio settings | Opens the audio settings. While running, the button shows the device and sample rate in use. | — |
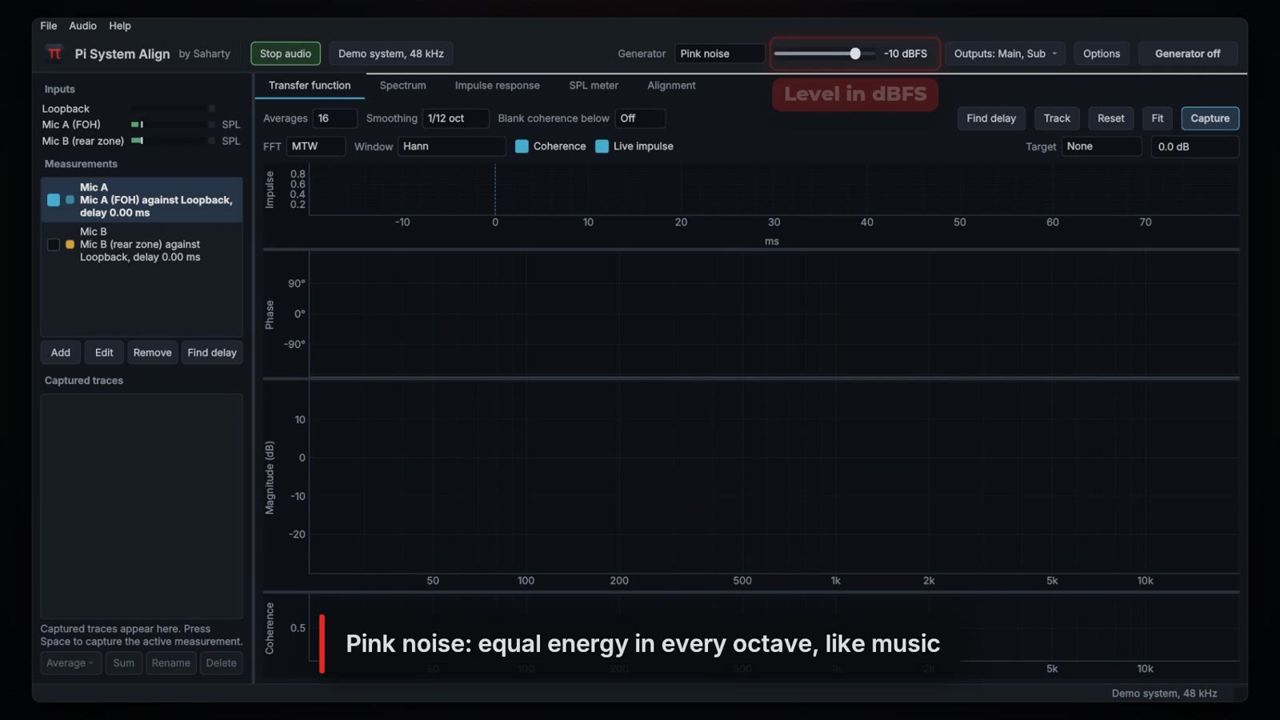
| Generator type | Signal type: Pink noise, Pink periodic, White noise, Sine or Log sweep. | Pink noise |
| Frequency (Sine only) | Sine frequency. | 10–24000 Hz, default 1000 Hz |
| Level slider | Generator level in dBFS (sine reference). | −60 to 0 dBFS, default −18 dBFS |
| Outputs | Chooses which outputs the generator feeds. It includes All outputs and No outputs. | — |
| Options | Opens Generator options: band limits, sine frequency and sweep length. | — |
| Generator off / Generator on | Turns the generator on or off (G). | Off |
Generator options contains:
| Control | What it does | Range/default |
|---|---|---|
| Limit the noise to a band | Band-limits the noise between Low and High. | Off |
| Low | Lower band limit. | 5–20000 Hz, default 20 Hz |
| High | Upper band limit. | 10–24000 Hz, default 20000 Hz |
| Sine frequency | Frequency of the sine. | 10–24000 Hz |
| Sweep length | Length of the log sweep. | 1.4 s, 2.7 s, 5.5 s, 10.9 s; default 2.7 s |
Warning: The generator can play loud signals. Always start with the level low and the amplifiers turned down, and bring the level up gradually. Protect your hearing, your audience and your loudspeakers.
Sidebar
The sidebar has three sections.
Inputs lists every input channel with a peak meter. A calibrated input shows SPL next to its meter. Right-click an input name for Input settings... and Calibrate....
Measurements lists your measurements. A measurement is a pair: a microphone input measured against a reference. Each entry shows its name, the inputs used, the delay compensation and whether delay tracking is on.
| Control | What it does |
|---|---|
| Tick box | Runs (ticked) or pauses the measurement. |
| Selecting an entry | Makes it the active measurement (shown in bold). Capture, Find delay and the live impulse act on the active measurement. |
| Add | Adds a measurement. |
| Edit | Edits the selected measurement (or double-click it). |
| Remove | Removes the selected measurement. |
| Find delay | Finds the delay of the selected measurement (D). |
| Right-click menu | Add measurement..., Edit..., Find delay, Track delay, Remove. |
Captured traces lists the traces you have captured or imported. Tick a trace to show it and untick it to hide it. Select several traces with Shift or Ctrl/Cmd.
| Control | What it does |
|---|---|
| Average | Averages the selected traces: Power average, Complex average or dB average. |
| Sum | Complex sum of the selected traces. It predicts how the sources sound when they play together. |
| Rename | Renames the selected trace. |
| Delete | Deletes the selected traces. |
| Right-click menu | Edit offset, delay and polarity..., Colour..., Rename..., Export as CSV..., Show only selected, Show all, Hide all, Import transfer function..., Import spectrum..., Delete. |
Analysis tabs
| Tab | Shortcut | Purpose |
|---|---|---|
| Transfer function | Ctrl/Cmd+1 | Live impulse, phase, magnitude and coherence of your measurements. |
| Spectrum | Ctrl/Cmd+2 | Real-time analyser and spectrograph. |
| Impulse response | Ctrl/Cmd+3 | Sweep measurement, decay curves and room acoustics. |
| SPL meter | Ctrl/Cmd+4 | Weighted sound level meter with a log. |
| Alignment | Ctrl/Cmd+5 | Mic placement, Crossover alignment, Arrival times, Delay calculator. |
Status bar
The left side of the status bar shows messages, for example the result of Find delay. On the right you see the cursor readout (frequency, level, phase and coherence under the mouse), Dropouts (audio buffer under-runs, shown only when there are any) and the audio engine information.
Menus
| Menu | Items |
|---|---|
| File | Open session..., Save session..., Import transfer function..., Import spectrum..., Quit |
| Audio | Audio settings..., Start or stop audio, Demo system processor..., Reset averages |
| Help | Keyboard shortcuts, Licence..., About Pi System Align by Saharty |
How dual-channel measurement works
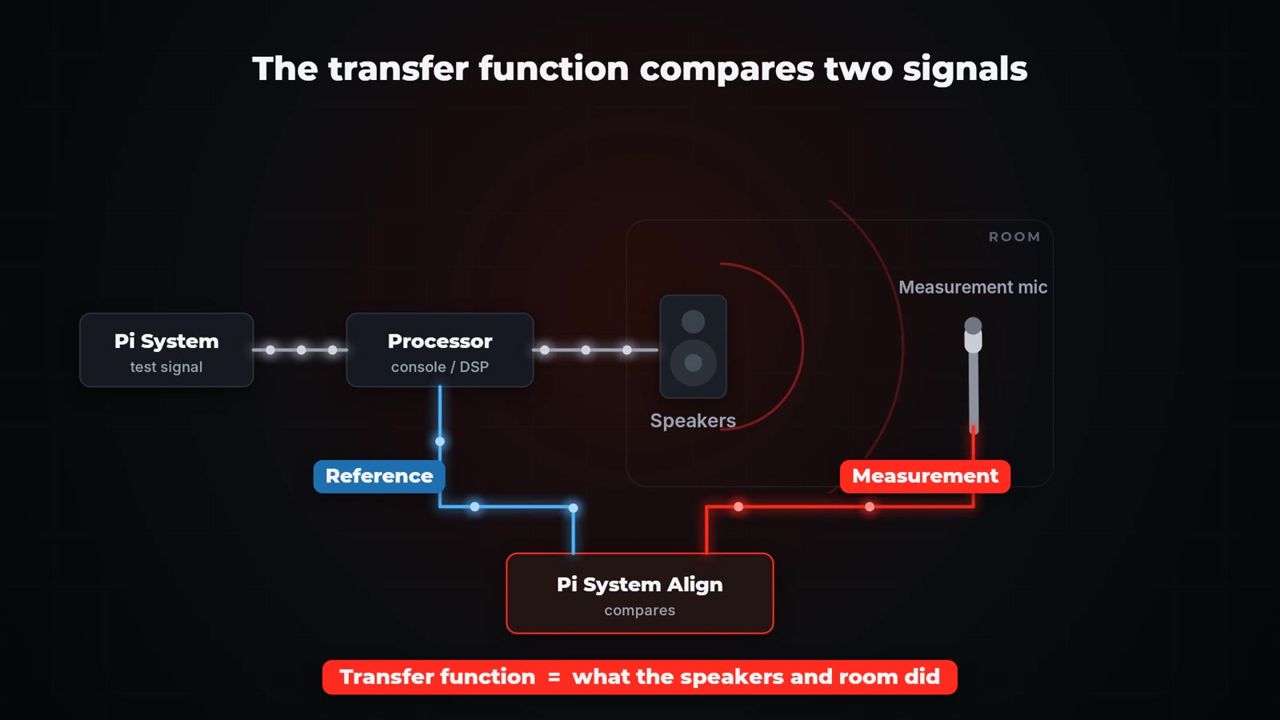
Pi System Align compares two signals. The reference is the signal you send to the system. The measurement is what the microphone hears after the processor, amplifiers, loudspeakers and room. The difference between them is the transfer function: what the speakers and the room did to your signal. Because the analysis compares the two signals, it works with pink noise and also with any broadband programme, such as music or speech.
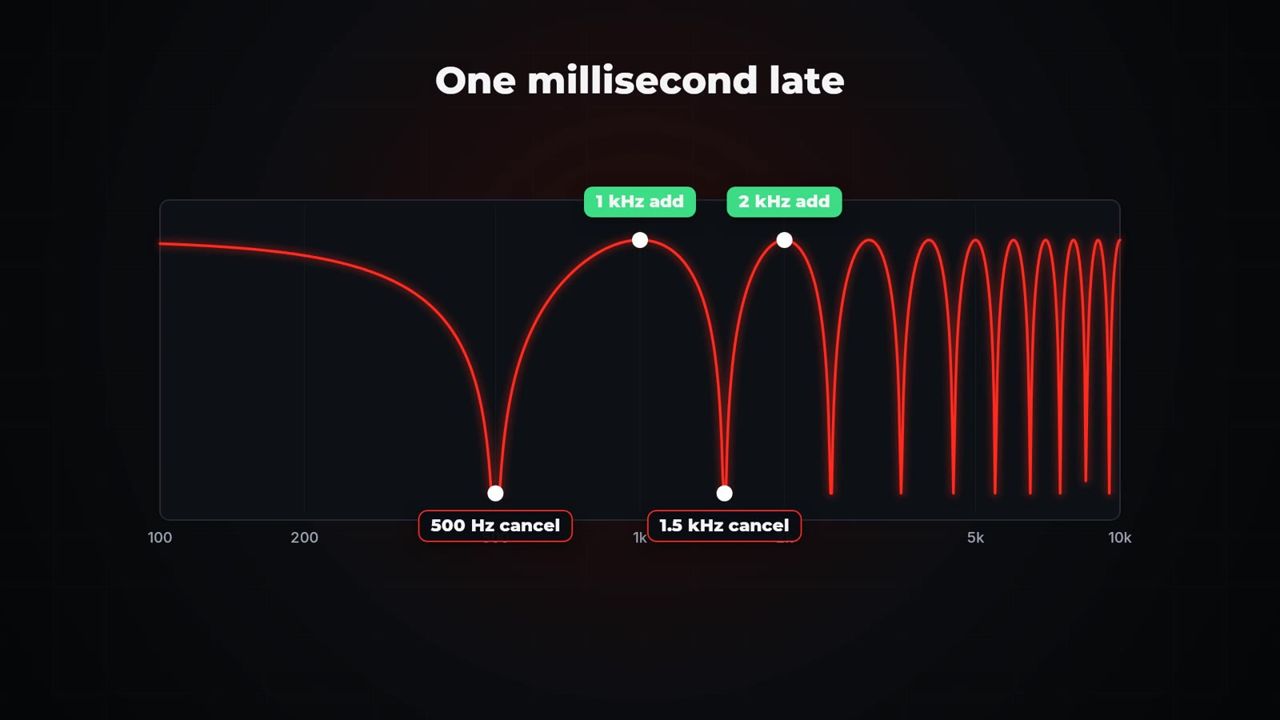
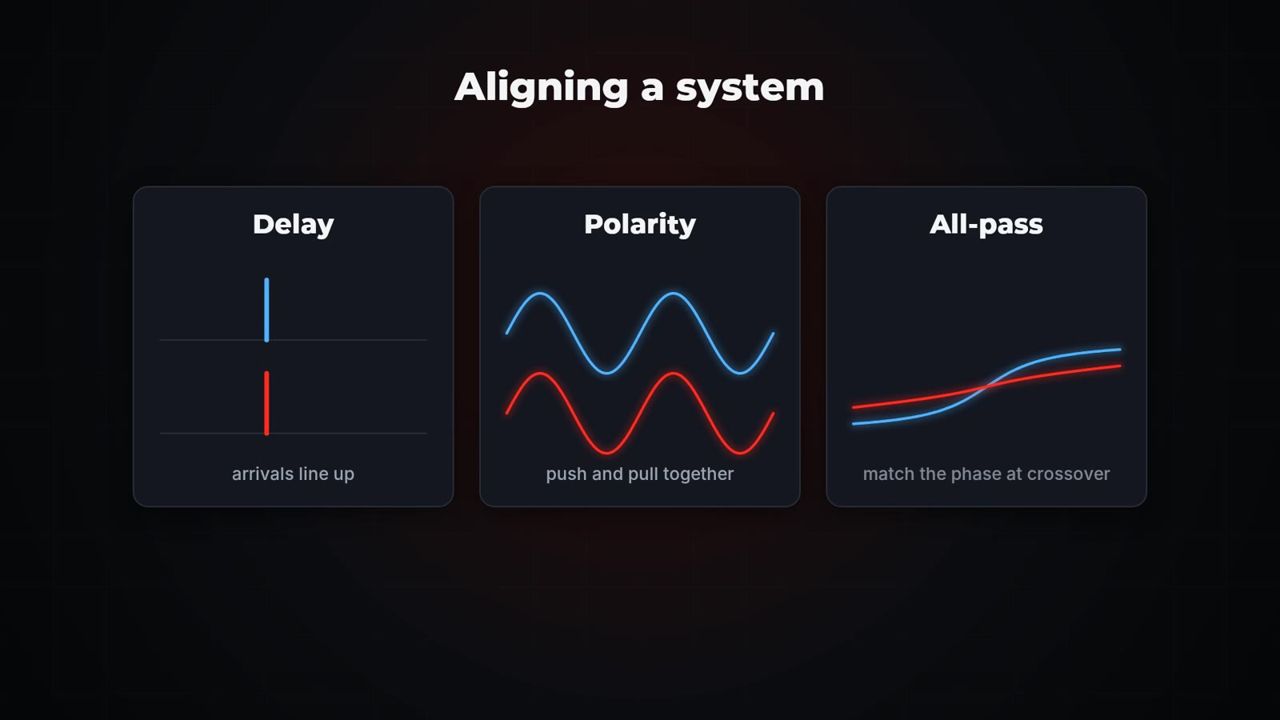
When two loudspeakers cover the same seat, their sound adds up there. If one arrives a little late, some frequencies add while others cancel. Even 1 ms of difference creates deep cancellations across the spectrum. Alignment means changing delay, polarity and sometimes the phase (with an all-pass filter), so the sources arrive together where they overlap.
Practising with the demo system
The Demo system (built-in) is a virtual PA in a room. It has three outputs (Main, Sub, Delay tower) and three inputs (Loopback, Mic A (FOH), Mic B (rear zone)). The virtual microphones are pre-calibrated, so they read in dB SPL. Two measurements are set up for you: Mic A (active) and Mic B (paused).
How to take your first demo measurement
- Make sure Demo system (built-in) is selected in Audio settings, then press Start audio.
- Under Outputs, choose which virtual speakers play: for example Main only, Sub only, or both.
- Press G to start the pink noise.
- Press D to find the delay of Mic A.
- Watch the Transfer function tab fill in, then press Space to capture.
The demo system processor
Open Audio > Demo system processor... (or Demo processor... on the Crossover alignment page). It works exactly like a real loudspeaker processor, one row per output:
| Control | What it does | Range/default |
|---|---|---|
| Delay | Output delay. | 0–2000 ms, default 0 ms |
| Polarity | Invert flips the polarity. | Off |
| Gain | Output gain. | −40 to +12 dB, default 0 dB |
| Mute | Mutes the output. | Off |
| All-pass | Off, 1st order or 2nd order. | Off |
| Frequency | All-pass frequency. | 10–2000 Hz, default 100 Hz |
| Q | All-pass Q (2nd order). | 0.3–10, default 0.71 |
| Reset all | Returns every output to its default. | — |
Changes apply immediately. Use the processor to practise each alignment tool, then measure again to check the result.
Connecting a real system
How to choose your interface
- Click Audio settings in the command bar.
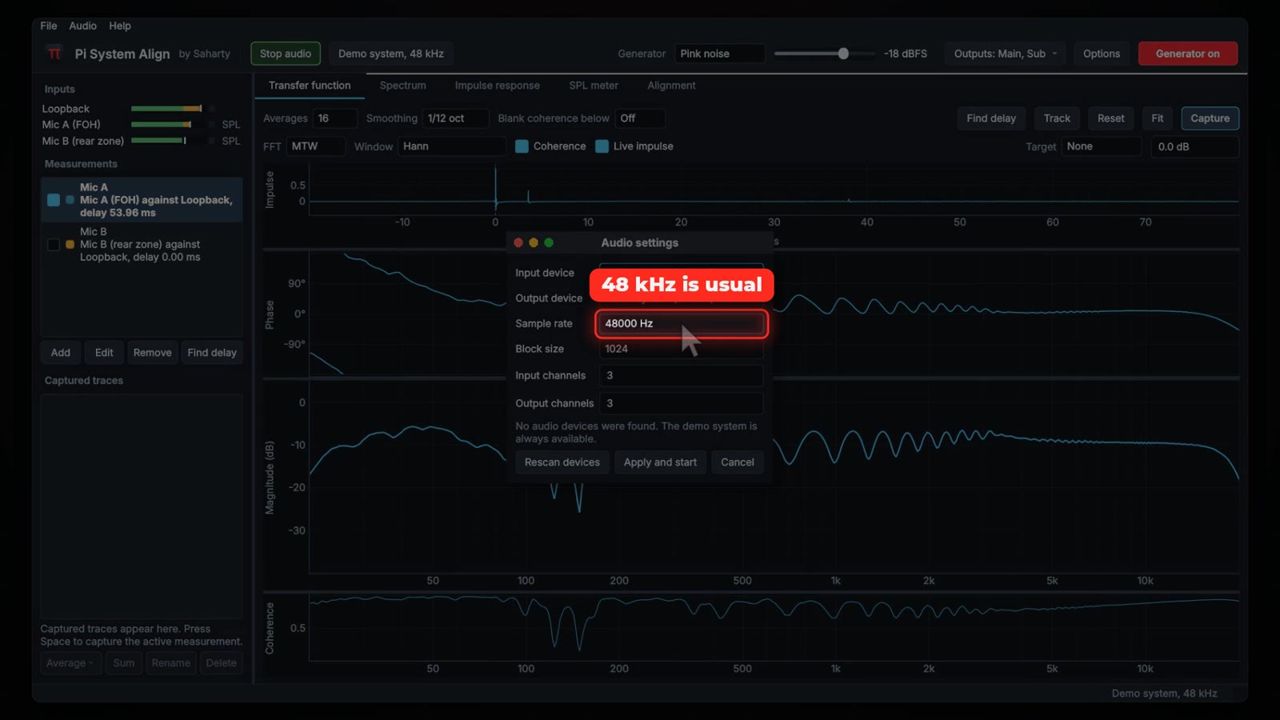
- Choose the Input device and the Output device. If the input device also has outputs, it is selected for output automatically. Use the same interface for input and output for stable timing.
- Choose the Sample rate and Block size.
- Set the number of Input channels and Output channels.
- Press Apply and start.
| Control | What it does | Range/default |
|---|---|---|
| Input device | Interface for the reference and microphone inputs. Includes Demo system (built-in). | — |
| Output device | Interface the generator plays through, or No output. | — |
| Sample rate | Audio sample rate. | 44100, 48000, 88200, 96000 Hz; default 48000 Hz |
| Block size | Audio buffer size in samples. | 256, 512, 1024, 2048, 4096; default 1024 |
| Input channels | Number of inputs to open. | Up to 64 (the device's maximum) |
| Output channels | Number of outputs to open. | Up to 64 (the device's maximum) |
| Rescan devices | Looks for interfaces again. | — |
The reference: loopback or internal generator
For the best timing, use a loopback. Take the signal you send to the system (for example a spare output of your interface, or a matrix output from the console or processor) and wire it back into an input. That input becomes the reference.
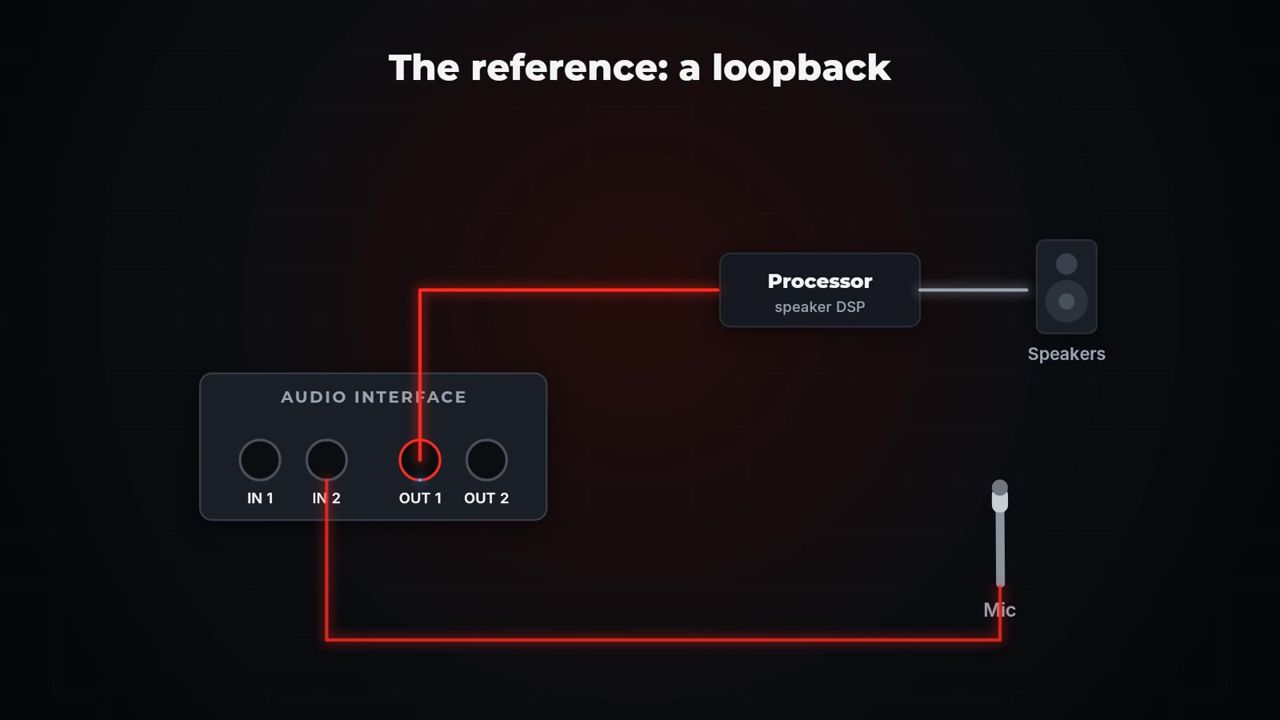
If you can't wire a loopback, choose Generator (internal reference) as the reference. This works, but a loopback gives the most reliable timing because it includes everything in your own signal path.
The measurement microphone
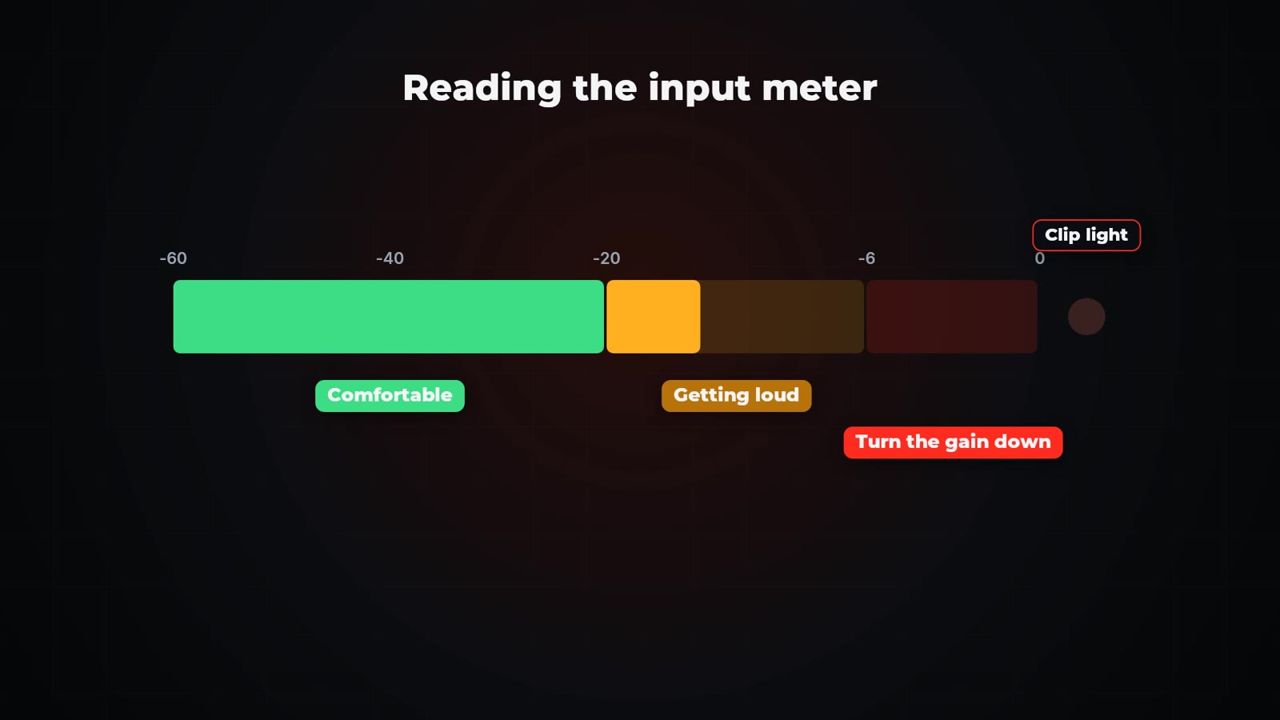
Use an omnidirectional measurement microphone, with +48 V phantom power if it needs it. Set the preamp gain so the input meter sits comfortably in the green and amber with pink noise playing, and never in the red.
Inputs, calibration and measurements
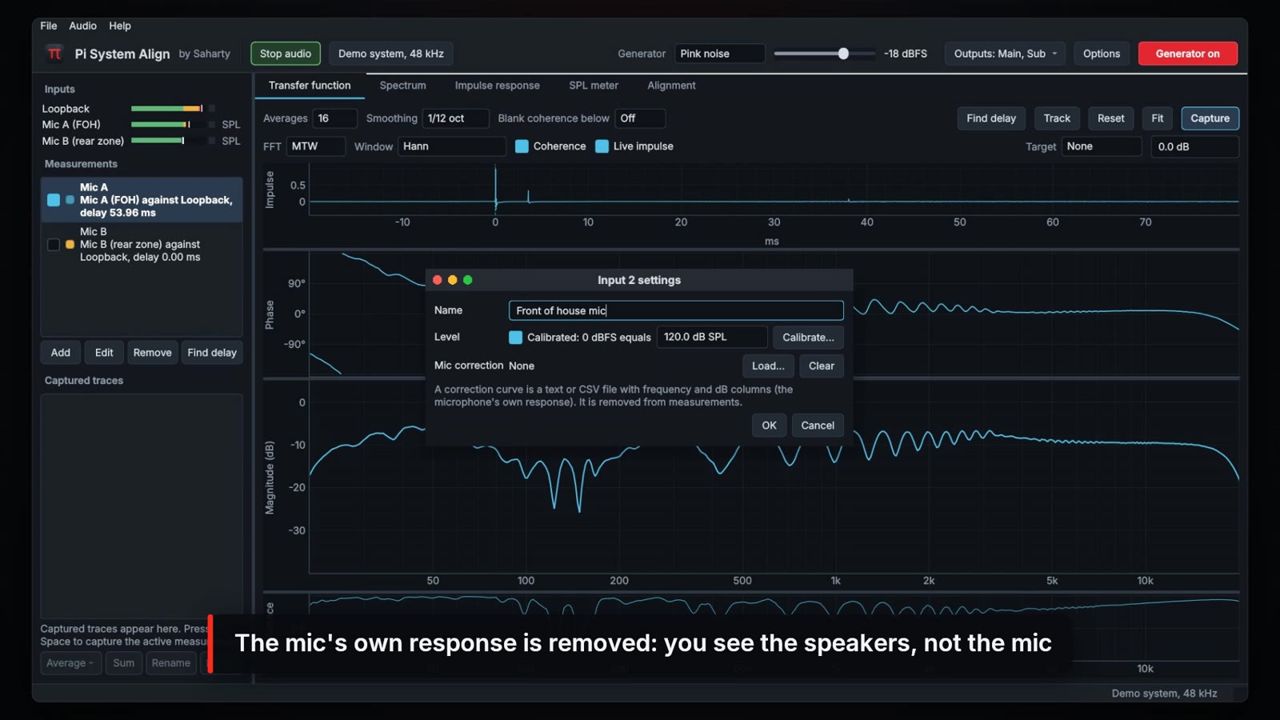
How to set up an input
- Right-click the input name in the sidebar and choose Input settings....
- Give it a clear Name, for example Loopback or Mic FOH.
- To remove your microphone's own response, press Load... under Mic correction and choose its correction file. This is a text or CSV file with frequency and dB columns (
.txt,.csv,.frdor.cal). Press Clear to remove it. - Press OK.
| Control | What it does | Range/default |
|---|---|---|
| Name | Input name shown everywhere in the app. | — |
| Calibrated: 0 dBFS equals | Turns calibration on and sets the SPL that full scale represents. | 0–200 dB SPL |
| Calibrate... | Measures an acoustic calibrator to set the level. | — |
| Mic correction | Load... or Clear a microphone correction curve. | None |
How to calibrate a microphone input
Calibration makes the analyser and the SPL meter read in dB SPL instead of dBFS.
- Start audio.
- Fit the acoustic calibrator on the microphone and switch it on.
- Right-click the input and choose Calibrate... (or press Calibrate... on the SPL meter tab).
- Choose the Calibrator level (dB SPL): 94.0, 104.0 or 114.0, or type your calibrator's level.
- Wait a few seconds, then press Measure. The dialog shows the frequency and level it measured, and what full scale will read.
- Press Use this calibration.
Note: If the strongest tone is not close to 1 kHz, Pi System Align warns you to check the calibrator. If the input is within 3 dB of clipping, it asks you to lower the preamp gain and calibrate again.
How to add a measurement
- In Measurements, press Add.
- Enter a Name, for example FOH centre.
- Choose the Measurement input (the microphone) and the Reference (the loopback input, or Generator (internal reference)).
- Leave Delay compensation at 0 ms. Find delay fills it in for you.
- Pick a Colour and press OK.
| Control | What it does | Range/default |
|---|---|---|
| Name | Measurement name. | Mic 1, Mic 2, … |
| Measurement input | The microphone channel. | — |
| Reference | Loopback input or internal generator. | — |
| Delay compensation | Time offset between reference and microphone. | 0–2000 ms, default 0 ms |
| Colour | Trace colour. | Next free colour |
You can run several measurements at once, for example two microphones against the same loopback. Tick each one you want to run, and select the one you want to work on.
Measuring the transfer function
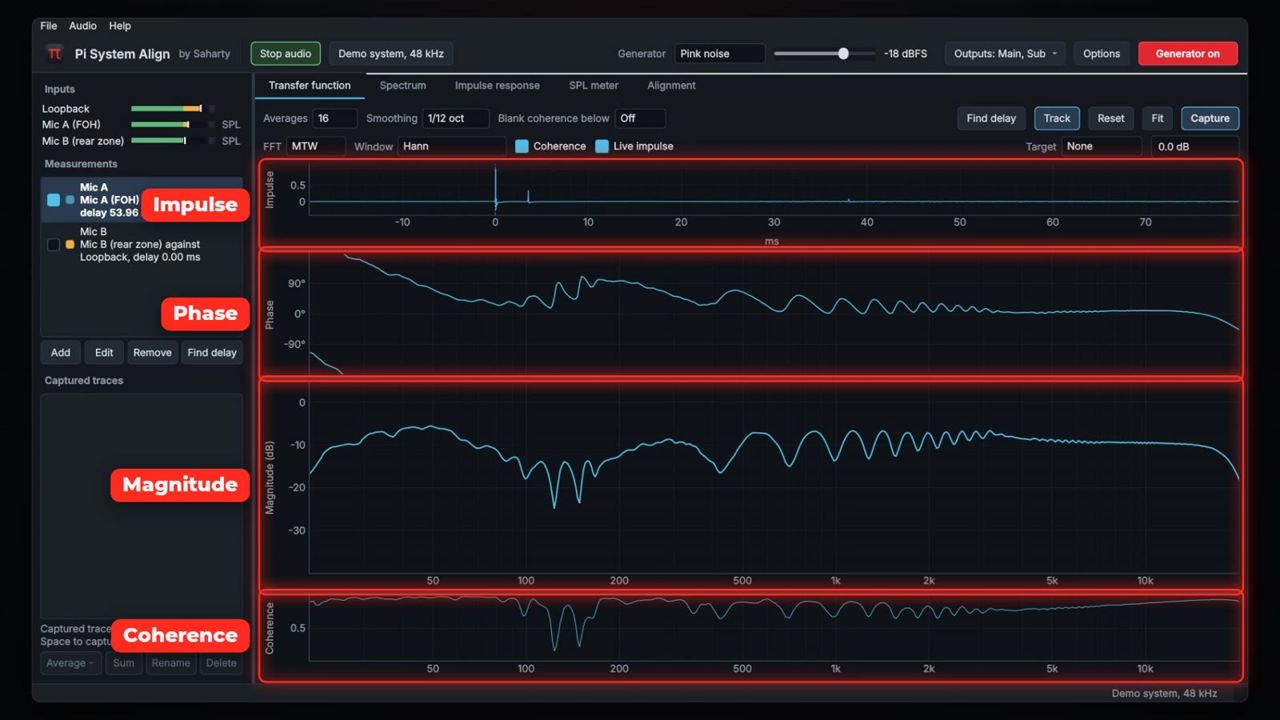
The Transfer function tab shows four stacked plots: Impulse (the live impulse response), Phase, Magnitude (dB) and Coherence. Phase, magnitude and coherence share the same frequency axis.
Toolbar controls
| Control | What it does | Range/default |
|---|---|---|
| Averages | Number of averages. | 1, 2, 4, 8, 16, 32, 64, 128, Inf; default 16 |
| Smoothing | Frequency smoothing of the display. | None, 1/48, 1/24, 1/12, 1/6, 1/3, 1 oct; default 1/12 oct |
| Blank coherence below | Hides magnitude and phase where coherence is below the threshold. | Off, 10%–50%; default Off |
| FFT | MTW (multi-time-window) or a fixed FFT size. | MTW, 4096, 8192, 16384, 32768, 65536; default MTW |
| Window | FFT window. | Hann, Blackman-Harris, Hamming, Flat top, Rectangular; default Hann |
| Coherence | Shows or hides the coherence plot. | On |
| Live impulse | Shows or hides the impulse plot. | On |
| Target | Draws a target curve on the magnitude plot. | None, Flat, Tilt, Live sound, Custom...; default None |
| Target offset | Moves the target curve up or down. | −80 to +80 dB, default 0 dB |
| Find delay | Finds the delay of the active measurement (D). | — |
| Track | Keeps following the delay of the active measurement. | Off |
| Reset | Restarts averaging (R). | — |
| Fit | Fits the magnitude scale to the active measurement. | — |
| Capture | Captures the active measurement as a trace (Space). | — |
MTW uses long FFTs at low frequencies and short ones at high frequencies. This gives you fine resolution in the low end and a fast, clean response in the highs. The fixed sizes are useful when you want the same resolution at every frequency.
Target curves: Flat is a 0 dB line. Tilt slopes at −3 dB per decade around 1 kHz. Live sound adds a low-end shelf of about +7 dB and rolls off about 1 dB per octave above 2 kHz. Custom... loads your own curve from a .txt, .csv or .frd file with frequency and dB columns. When a target is shown, Fit also moves the target to the level of your measurement.
How to find the delay
- Turn on the generator (G) with the right outputs selected.
- Press Find delay (or D).
- The status bar reports the delay, for example "Mic A: delay 42.17 ms, peak 38 dB above the noise." If the main impulse peak is negative, the message also says "The impulse peak is negative." This hints at a polarity inversion somewhere in the path.
The delay is stored in the measurement's Delay compensation, so the phase trace becomes readable and the coherence rises. The delay finder searches up to one second.
Tip: Turn on Track (or Track delay in the measurement's right-click menu) when the delay can drift, for example outdoors with wind and changing temperature. Pi System Align checks the delay again every 2 seconds.
How to read the plots
- Magnitude shows the level at each frequency. Peaks and dips are where you might use EQ, or where sources interfere.
- Phase shows the timing at each frequency. A flat phase in the crossover region means the sources are in time there.
- Coherence (0 to 1) tells you how much to trust the data. Above about 0.9 is good. Low coherence means noise, reflections or a position in a deep cancellation.
- Impulse shows the arrival in time. A clean, single peak at 0 ms means the delay is right.
Move the mouse over a plot to read the exact frequency, level, phase and coherence in the status bar.
Working with captured traces
A captured trace is a snapshot of a measurement. It keeps the magnitude, phase and coherence, plus the delay compensation that was in use when you captured it.
How to capture, compare and edit traces
- Press Space (or Capture) to capture the active measurement. On the Spectrum tab, Space captures the spectrum of each shown input.
- Tick or untick traces to compare them with the live measurement.
- Double-click a trace (or right-click > Edit offset, delay and polarity...) to change its Name, Colour, Level offset (−60 to +60 dB), Added delay (−1000 to +1000 ms) and Invert polarity. The dialog also shows the delay compensation at capture time.
How to average positions
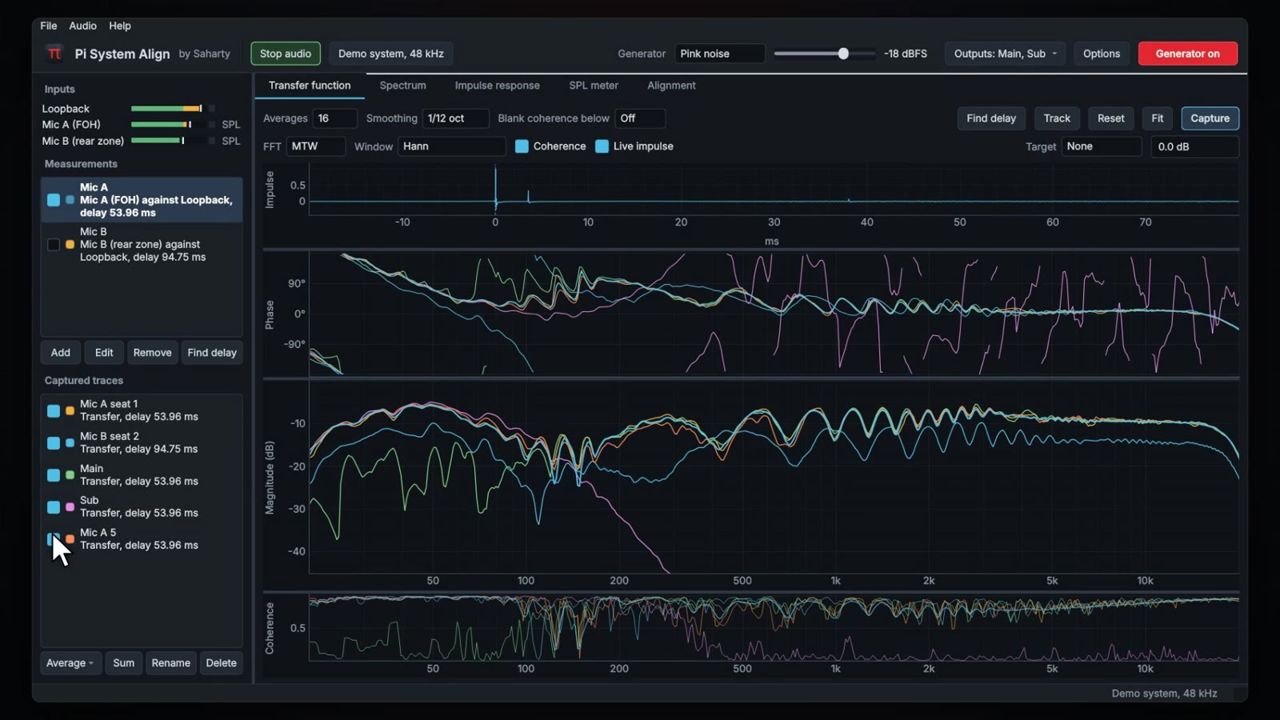
One microphone position doesn't tell you the whole story. Measure several seats, capture each one, then average them, and make your EQ decisions on the average.
- Capture a trace at each position.
- Select the traces (Shift-click or Ctrl/Cmd-click).
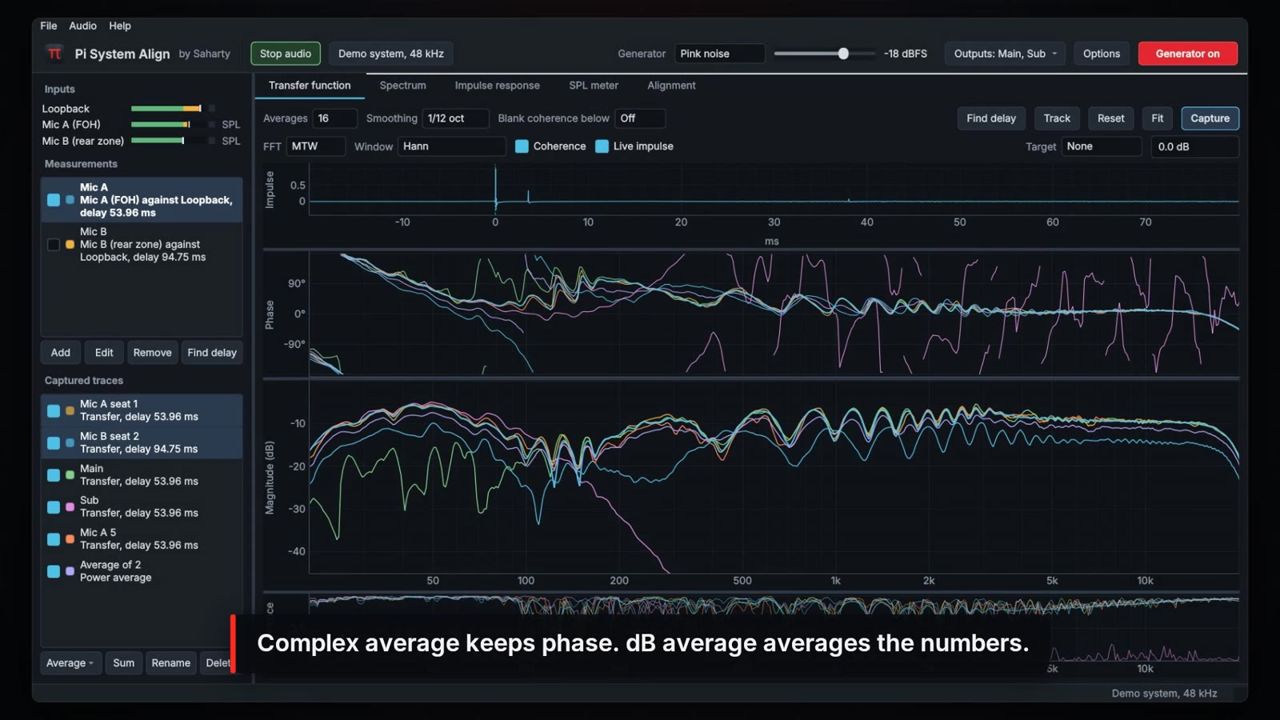
- Press Average and choose Power average, Complex average or dB average.
Power average is the usual choice for averaging several positions. Complex average keeps the phase, and is only meaningful when the traces share the same timing.
How to predict a combined response
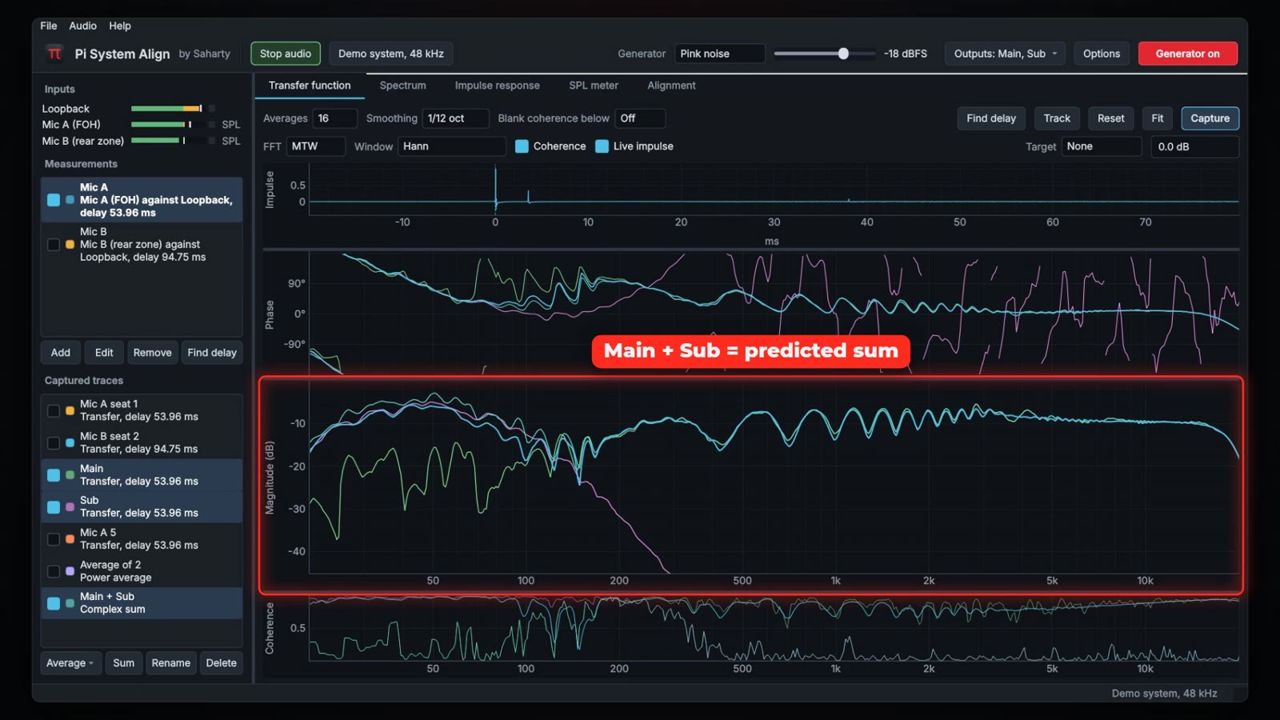
Select two or more transfer function traces and press Sum. Pi System Align calculates the complex sum, which is the response you would get with those sources playing together, including their delay and polarity. Every trace in the sum needs phase data.
Import and export
- Import: choose File > Import transfer function... or Import spectrum... (or use the traces right-click menu) to load a
.csv,.txtor.frdfile. For a transfer function the columns are frequency, magnitude (dB) and optionally phase (degrees) and coherence. For a spectrum they are frequency and level. - Export: right-click a trace and choose Export as CSV.... Transfer functions are exported with frequency, magnitude, phase and coherence. Spectra are exported with frequency and level.
Using the spectrum analyser
The Spectrum tab shows the energy at each frequency for one or more inputs. Unlike the transfer function, it doesn't need a reference.
| Control | What it does | Range/default |
|---|---|---|
| Banding | Frequency resolution. | 1/1, 1/3, 1/6, 1/12, 1/24, 1/48 oct; default 1/3 oct |
| Averaging | Time averaging. | None, 0.25 s, 0.5 s, 1 s, 2 s, 4 s, 8 s, Inf; default 1 s |
| Weighting | Frequency weighting. | Z, A, C; default Z |
| Inputs | Chooses which inputs the analyser shows. | — |
| Peak hold | Draws dashed peak-hold traces. | Off |
| Bars | Draws octave and third-octave bands as bars (first input shown). | On |
| Spectrograph | Shows the spectrograph under the analyser. | Off |
| Range | Spectrograph colour range. | 40, 60, 80, 100 dB; default 60 dB |
| Clear peaks | Clears the peak-hold traces. | — |
| Reset | Restarts averaging (R). | — |
| Capture | Captures the spectrum of each shown input (Space). | — |
Levels read in dB SPL when the input is calibrated and in dBFS when it is not. Bars appear only at 1/1 and 1/3 octave banding.
The Spectrograph shows the last ten seconds as a scrolling colour map. A frequency that stays bright in the same place, like a monitor that is about to feed back, shows up as a steady line.
Measuring the impulse response and room acoustics
The Impulse response tab measures how the room responds over time and calculates the standard room acoustics parameters.
| Control | What it does | Range/default |
|---|---|---|
| Source | Sweep plays a log sweep and gives the most accurate room acoustics. Live signal uses the running generator or programme: quick and indicative, with less range at high frequencies. | Sweep |
| Sweep | Sweep length. Lengths that don't fit the audio buffer are greyed out. | 1.4, 2.7, 5.5, 10.9 s; default 2.7 s |
| Averages | Number of sweeps averaged. | 1–8, default 1 |
| Input | The measurement microphone. | — |
| Reference | Generator (internal) or an input. | — |
| Measure | Starts the measurement. | — |
| Cancel | Stops a running measurement. | — |
| Import WAV | Analyses an impulse response from a WAV file. | — |
| Export WAV | Saves the impulse response as a WAV file. | — |
| Display | Log (ETC), Linear or Decay (Schroeder). | Log (ETC) |
How to measure a room
- Choose the outputs that feed the system under Outputs in the command bar.
- Set Source to Sweep, choose a Sweep length and the number of Averages.
- Choose the Input (your microphone) and the Reference.
- Press Measure. Keep the room quiet while the sweep plays.
- Read the result. The status line reports the arrival time and the impulse-to-noise ratio.
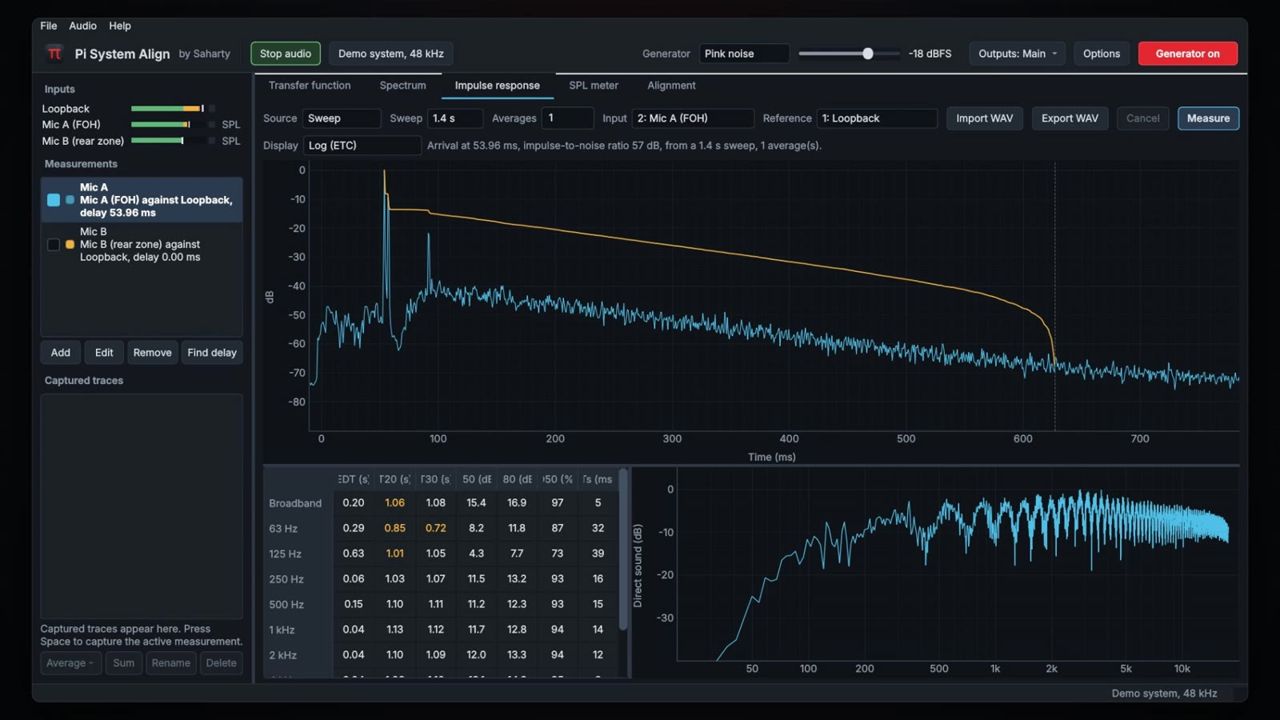
The table lists the Broadband values and the octave bands from 63 Hz to 8 kHz:
| Column | Meaning |
|---|---|
| EDT (s) | Early decay time. |
| T20 (s), T30 (s) | Reverberation time from the −5 to −25 dB and −5 to −35 dB parts of the decay. |
| C50 (dB) | Clarity for speech. |
| C80 (dB) | Clarity for music. |
| D50 (%) | Definition: the share of energy in the first 50 ms. |
| Ts (ms) | Centre time. |
The Direct sound (dB) plot shows the frequency response of the direct sound. The dashed vertical line marks where the analysis truncates the decay.
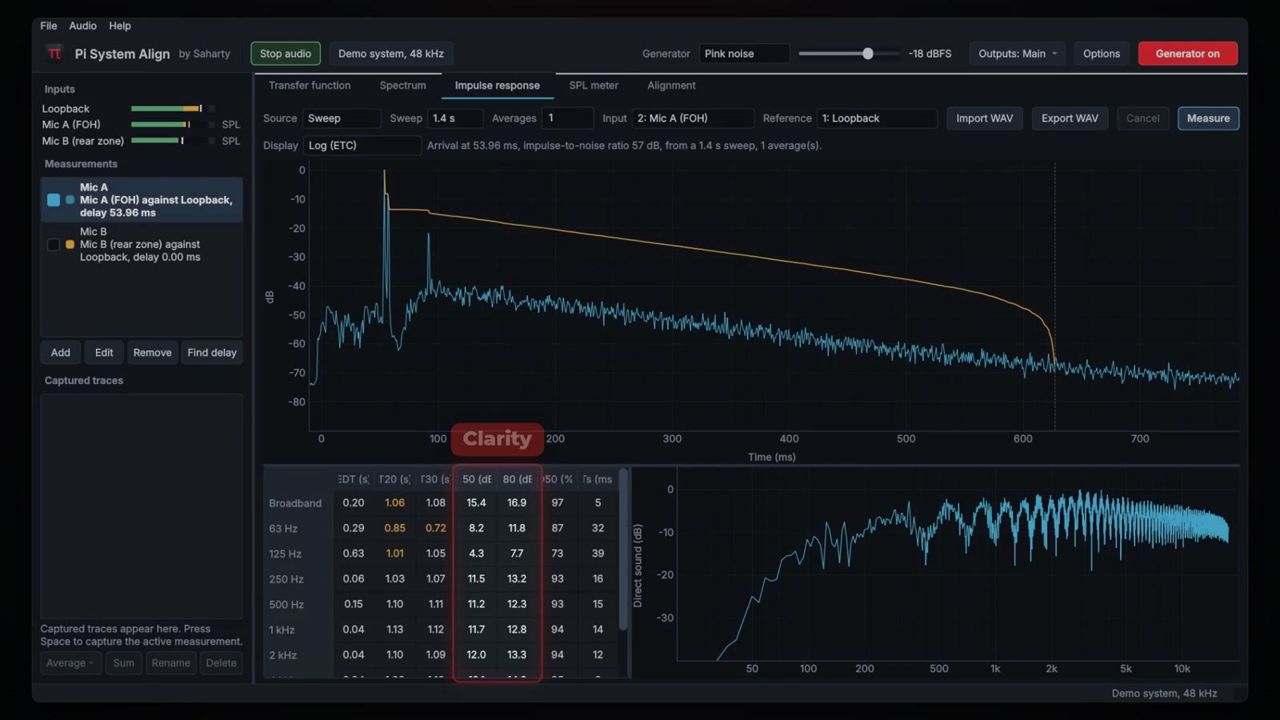
Note: A T20 or T30 value shown in amber means the decay was not a clean straight line. Hover over it to see the fit quality, and treat it with care.
Using the SPL meter
The SPL meter tab is a weighted sound level meter with Leq windows, maxima, peaks and a history.
| Control | What it does | Default |
|---|---|---|
| Input | The input to meter. Uncalibrated inputs are marked (not calibrated). | — |
| Main reading | The large reading: LAeq, LAF, LAS, LCeq, LCF, LZF, LAeq 1 min, LAeq 10 min, LAeq 15 min, LCeq 15 min or LCpeak. | LAeq |
| Calibrate... | Calibrates this input with an acoustic calibrator. | — |
| Export log | Saves the per-second log as CSV. | — |
| Reset | Restarts Leq, maxima and the log. | — |
The grid shows LAF, LAS, LAeq, LAFmax, LCF, LCS, LCeq, LCpeak, LZF, LZeq, LAeq 1 min, LAeq 10 min, LAeq 15 min, LCeq 1 min, LCeq 15 min and LZpeak. Fast uses a 1/8-second time constant and Slow uses 1 second. The running time shows under the main reading.
The history plot shows LAeq, LCeq and LAFmax for each second, covering up to the last hour. Export log writes a CSV with a time stamp and the per-second LAeq, LCeq, LZeq, LAFmax, LCFmax, LCpeak and LZpeak values.
Warning: The SPL meter is not a certified sound level meter (it is not an IEC 61672 class 1 or class 2 instrument). Don't use it as the only basis for noise-limit compliance or any legal or contractual measurement.
Without calibration the meter reads in dBFS. Calibrate the input first (see Inputs, calibration and measurements) to read in dB SPL.
Planning microphone positions
The Alignment > Mic placement page tells you where to put the microphone for each loudspeaker system, explains why, and tells you how to measure it.
How to build a placement plan
- Under Room, enter Depth, stage to far seats (5–400 m, default 30 m) and Width of the audience (4–300 m, default 24 m). Choose Mic height: Standing, 1.7 m or Seated, 1.2 m.
- Under Speaker systems, press Typical show for mains, subs, front fills, out fills and delays. Or use Add system to add Mains, Subs, Center fill, Front fills, Out fills, Under balcony or Delays one by one. Remove deletes the selected system.
- Select a system and set its sizes under Selected system. You can also rename it there. Sizes you don't edit follow the room.
- Read the plan view. Squares are speakers and numbered circles are mic positions, coloured by system.
- Select a row in the table (Mic, System, Position, Where) to see the full instructions on the right: the reason for the position, what to align to, and numbered measuring steps.
System sizes
| System | Settings (range) |
|---|---|
| Mains | Throw to the far seats (5–250 m), Distance between left and right (0–60 m), Height of the array (1–30 m) |
| Subs | Largest size of the sub array (0.5–30 m) |
| Center fill | Coverage depth (1–40 m), Height of the speaker (0.2–10 m) |
| Front fills | Number of fills (1–16), Coverage depth (1–20 m), Height of the speakers (0.2–5 m) |
| Out fills | Throw along the side (3–100 m), Height of the speakers (0.5–20 m) |
| Under balcony | Overhang starts at (2–200 m), Coverage depth (2–60 m), Height of the speakers (1–10 m) |
| Delays | Distance from the mains (3–250 m), Coverage depth (2–100 m), Number of towers (1–12), Height of the speakers (0.5–20 m) |
What the plan suggests
The plan always lists the systems in measuring order: mains first, then subs, center fill, front fills, out fills, under-balcony fills and delays.
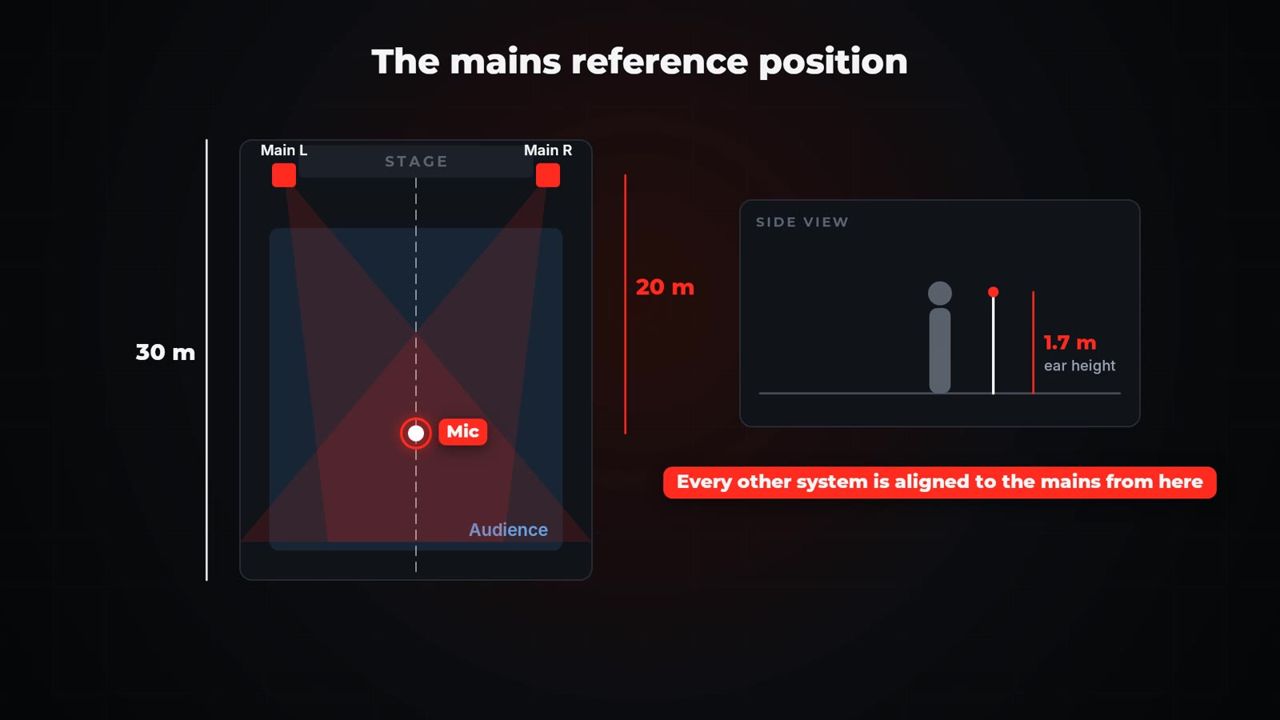
- Mains: a Reference position two-thirds of the way to the far seats on the centre line, plus a Near check and Edge left / Edge right checks. Every other system is aligned to the mains from the reference position.
- Subs: a Crossover position at exactly the same spot as the mains reference, plus a Front coverage check.
- Fills (center, front, under balcony): a coverage position and a Blend position where the fill hands over to the mains.
- Out fills: a coverage position and a Seam position on each side, where the mains' coverage edge meets the out fill.
- Delays: a coverage position for each tower and a Blend position further into the zone.
For fills and delays, the notes give a starting delay calculated from the geometry and the air temperature. They also give the value with an 8 ms image offset, which keeps the sound image on the stage. Warnings appear in amber, for example when the room is small for the system sizes you entered.
How to turn a position into a measurement
- Select a row in the table.
- Press Add as measurement. A new, paused measurement named after the position is added. It uses the active measurement's input and reference.
- Put the mic in place, tick the measurement in Measurements and press D.
Press Save plan to save the whole plan as a text file you can print or share with your crew.
General advice for every position
- Use one omnidirectional measurement microphone, the same one at every position. Point it at the source, or straight up if it is a random-incidence type (follow its data sheet).
- Put the mic at ear height and at least 1 m away from walls and other reflecting surfaces. Keep people out of the way during the measurement.
- Measure each system on its own first, then together. Mute the others at the processor or amplifier, not by pulling the signal. Always find the delay again after moving the mic.
- Check coherence before capturing. Above about 0.9 across the range you care about means a good position. If it is poor, move the mic half a metre to a metre and try again.
- Mark the position with tape or a note so you can return to the same spot after changes.
Aligning a crossover
The Alignment > Crossover alignment page finds the crossover region and the delay, polarity and all-pass settings that make two sources sum best.
| Control | What it does | Range/default |
|---|---|---|
| Source A, Source B | The two sources: live measurements (Live: …) or captured traces with phase. | — |
| Find the crossover region automatically | Finds the region where both sources are equally loud. | On |
| Range | Manual region (when automatic is off). You can also drag the shaded region on the plot. | 10–20000 Hz, default 60–160 Hz |
| Search | Largest delay to search. | 1–500 ms, default 20 ms |
| Allow polarity inversion | Includes inverted polarity in the search. | On |
| Suggest all-pass filters (below 500 Hz) | Adds an all-pass option when the filters don't match. | On |
| Analyse | Runs the analysis. | — |
| Apply to trace | Adds the selected delay and polarity to the source trace. | — |
| Demo outputs A / B, Apply to demo system, Demo processor... | With the demo system: applies the suggestion to the virtual processor. | — |
How to align subs to mains
- Put the mic at the mains reference position (see Planning microphone positions).
- Mute everything except the mains. Press D, then capture (Space) and rename the trace, for example Mains.
- Mute the mains and play only the subs. You can limit the generator to about 30–200 Hz in Generator options. Press D and capture Subs.
- Open Crossover alignment. Choose Mains as Source A and Subs as Source B.
- Press Analyse.
- Read the advice. For example: "Delay Subs by 4.20 ms." The text also shows how much the summation in the crossover region improves, and the phase difference at the frequency where both are equally loud.
- Apply the selected option in your processor, then measure both together to confirm.
Reading the result
- The Option / Polarity / Summation table lists the best delay first, then other good choices and, if useful, an all-pass option. Select a row to plot it.
- The Magnitude plot shows A, B, Sum now (dashed), Sum with suggestion (white) and Sum with all-pass (green dashed).
- The Phase plot shows both phases in the crossover region, before and after the change.
- The Summation plot shows how well the sources sum for every delay applied to B (negative values delay A). The solid line is normal polarity and the dashed line is inverted. The green marker shows the selected option.
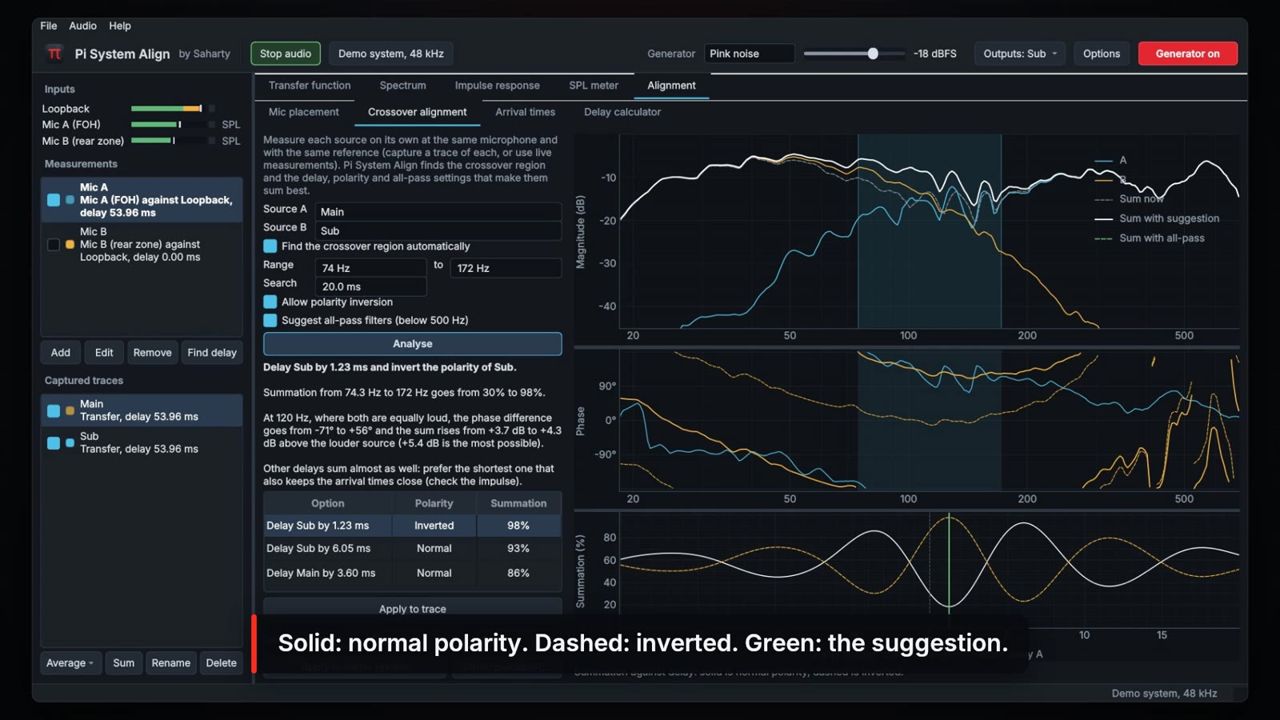
Tip: When several delays sum almost as well, choose the shortest one that also keeps the arrival times close. Check the impulse to confirm.
If the advice says the phase slopes still differ by more than about 45°, the filters don't match. An all-pass filter or a crossover change may help.
Aligning fills and seams
For front fills, center fills, under-balcony fills and out-fill seams there is no crossover to find, because the fill and the mains overlap across the whole speech range. Turn off Find the crossover region automatically and set Range to about 250 Hz to 4 kHz. Then analyse the traces captured at the blend or seam position. Many engineers then add 5 to 10 ms so the image stays on the stage.
Applying the result
- Apply to trace adds the selected delay (and polarity) to the captured trace, so you can Sum the traces and see the result. It doesn't work for live sources or all-pass options: apply those in your processor and measure again.
- With the demo system, Apply to demo system writes the delay, polarity and all-pass settings into the virtual processor. Pi System Align guesses the matching demo outputs from the source names.
Planning arrival times
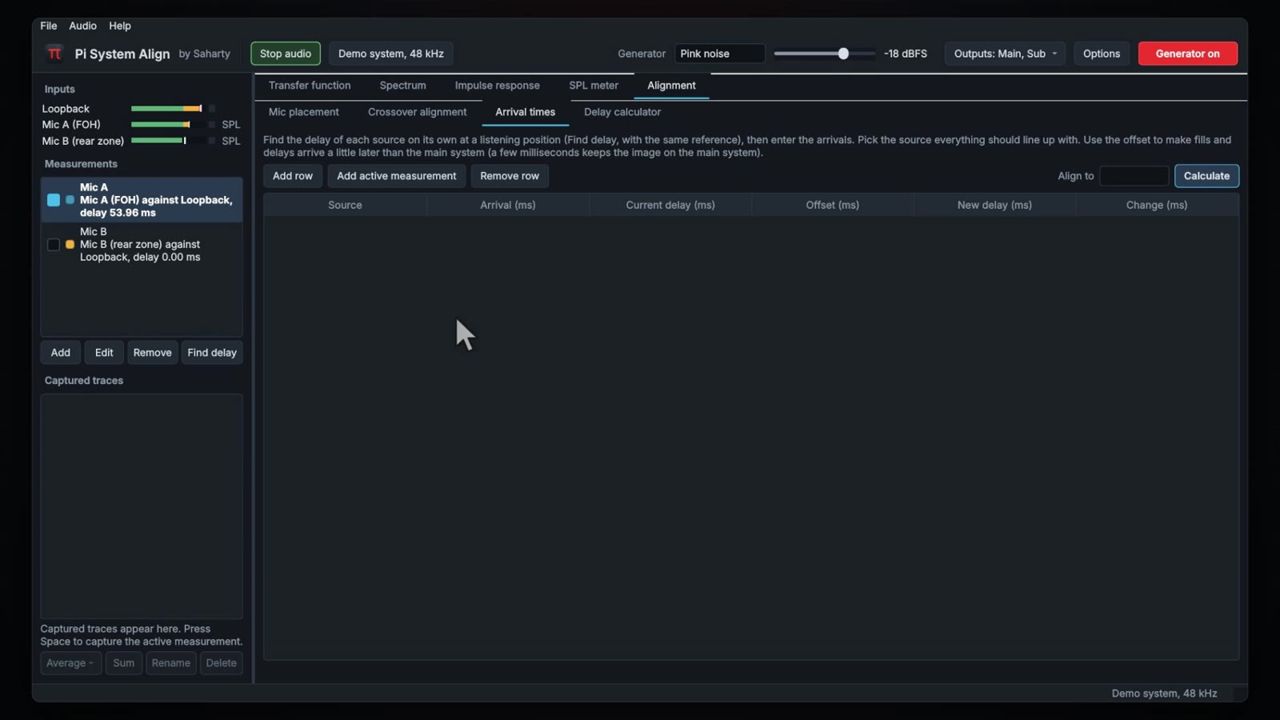
The Alignment > Arrival times page lines up several sources from their measured arrivals.
- For each source, play it alone at the listening position and press Find delay with the same reference.
- Press Add active measurement to add the delay found for the active measurement, or Add row to type one in.
- Fill in Current delay (ms) (the delay already set in your processor) and Offset (ms) (extra delay so fills and delays arrive a little after the mains).
- Choose the source everything should line up with under Align to.
- Press Calculate. New delay (ms) and Change (ms) are filled in, and a summary line lists the delays to set.
| Column | Meaning |
|---|---|
| Source | Source name (editable). |
| Arrival (ms) | Measured arrival time. |
| Current delay (ms) | Delay set in the processor now. |
| Offset (ms) | Extra delay to add. |
| New delay (ms) | Delay to set. |
| Change (ms) | Difference from the current delay. |
Tip: A few milliseconds of offset on fills and delays keeps the image on the main system. For delay towers, 5 to 15 ms is a common range.
Using the delay calculator
The Alignment > Delay calculator page turns distances into delay times. Set the Air temperature first (−20 to +50 °C, default 20 °C). The speed of sound is shown next to it and used everywhere, including the placement plan.
| Section | Inputs | Result |
|---|---|---|
| Distance and time | Distance (0–2000 m, default 10 m); Time (0–5000 ms, default 10 ms) | Time for the distance; distance in metres and feet for the time |
| Path difference | Listener to source A (default 25 m), Listener to source B (default 18 m) | Which source arrives earlier, and the delay to set on it |
| End-fire sub array | Boxes (2–8, default 4), Spacing (0.1–10 m, default 1.0 m) | Delay for each box (box 1 is the rearmost) |
| Gradient (cardioid) sub pair | Front to rear box (0.1–5 m, default 0.6 m) | Delay for the rear box, which is also polarity inverted |
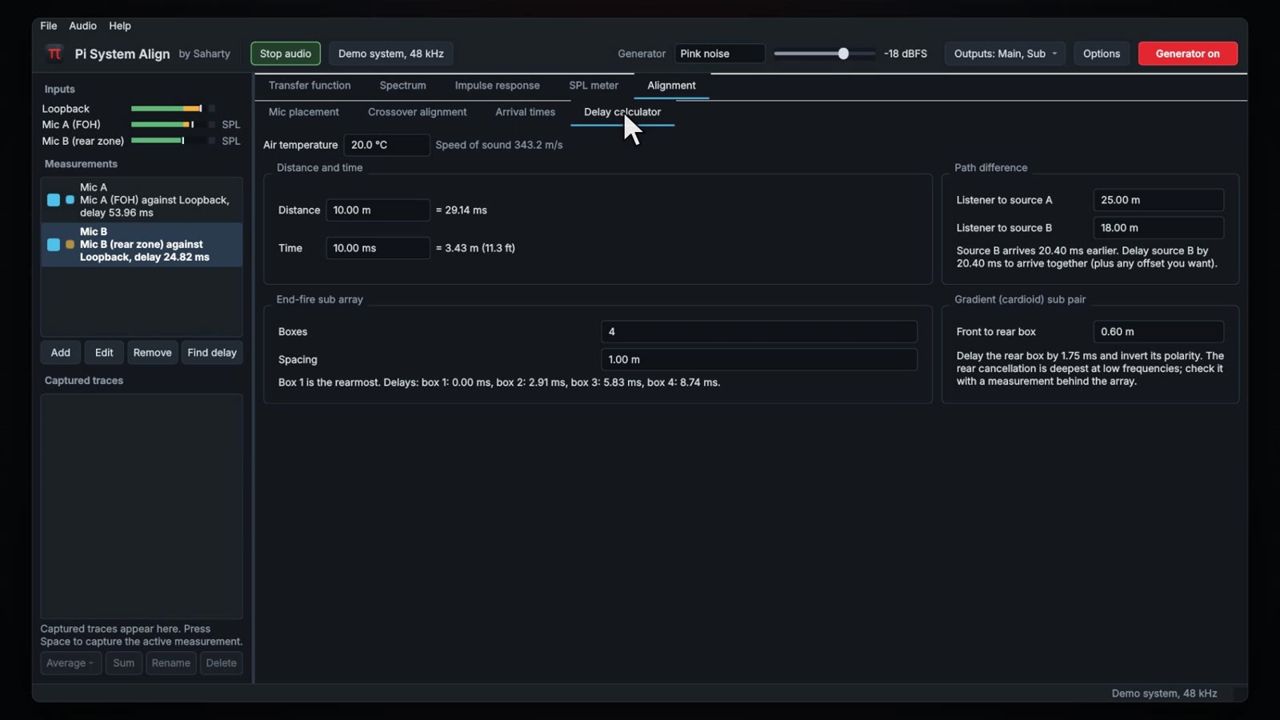
Note: A gradient pair cancels most at low frequencies behind the array. Check the result with a measurement behind the subs.
Sessions
A session (.pisa file) stores your settings, channels, measurements and all captured traces.
- File > Save session... (Ctrl/Cmd+S) saves the current session. Saving needs an active licence or the trial.
- File > Open session... (Ctrl/Cmd+O) opens a session. Opening always works, even in limited mode.
Tip: Save a session after each venue. Next time, open it and compare today's traces with last time's.
Settings & preferences
Pi System Align saves its state automatically when you quit, and restores it at the next launch. This includes:
- the audio device, sample rate, block size and channel counts;
- the input names, calibration and microphone corrections, stored separately for each device;
- the measurements and the generator outputs for each device;
- the transfer function, spectrum, impulse response and SPL meter settings;
- the air temperature and the mic placement plan;
- the window size, sidebar width and the open tab;
- the demo system processor settings.
Because inputs and measurements are stored for each device, switching between the demo system and your interface brings back each device's own setup.
| Where | Setting |
|---|---|
| Audio settings | Device, sample rate, block size, channels |
| Generator options | Band limits, sine frequency, sweep length |
| Input settings | Name, calibration, mic correction |
| Each tab's toolbar | Display and analysis settings |
| Delay calculator | Air temperature (also used by the placement plan) |
Keyboard shortcuts / remote control
| Key | Action |
|---|---|
| Space | Capture the active measurement (on the Spectrum tab: capture the spectrum) |
| D | Find the delay of the active measurement |
| G | Generator on or off |
| R | Reset averages |
| Ctrl+1 to Ctrl+5 | Switch views: Transfer function, Spectrum, Impulse response, SPL meter, Alignment |
| Ctrl+O | Open a session |
| Ctrl+S | Save a session |
On a Mac, use Cmd in place of Ctrl. You can also see the list from Help > Keyboard shortcuts.
Pi System Align has no OSC, MIDI or timecode remote control.
Tips for live/studio use
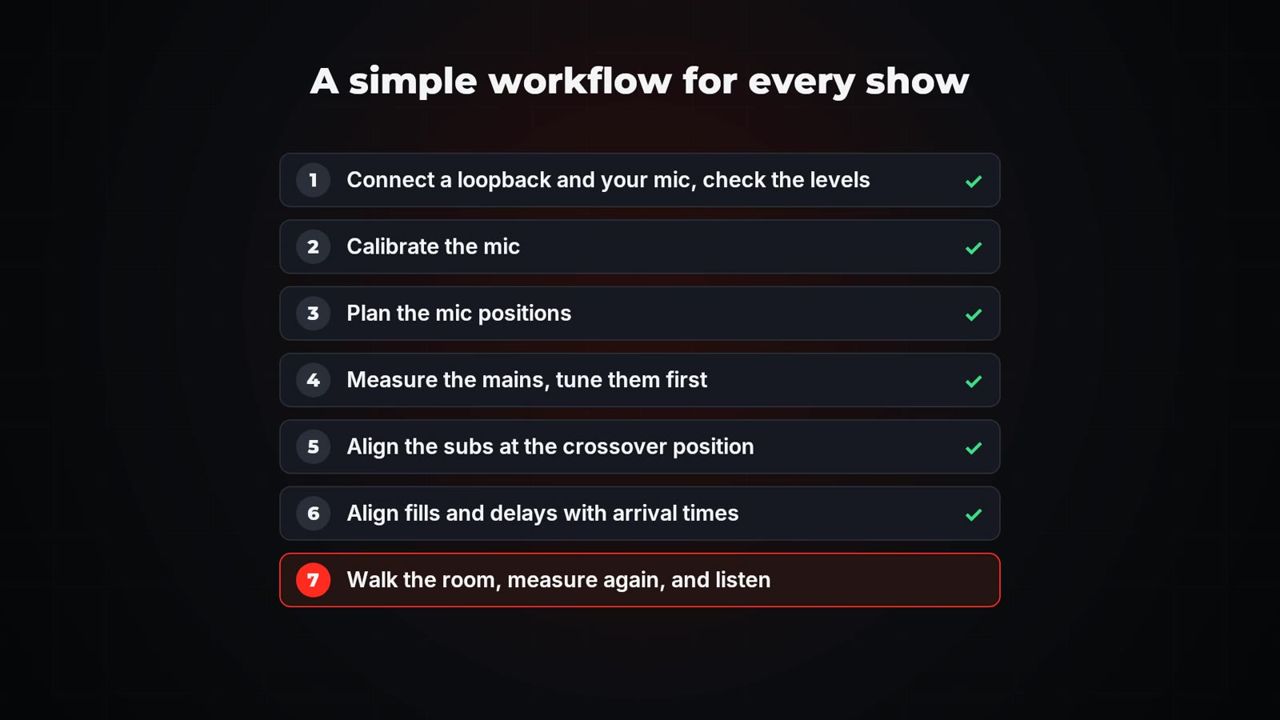
- Follow a simple workflow for every show: connect a loopback and your mic and check the levels; calibrate the mic; plan the mic positions; measure the mains and tune them first; align the subs at the crossover position; align fills and delays with arrival times; then walk the room, measure and listen.
- Use a loopback whenever you can. It includes the latency of your processor and converters, so arrivals and delays are measured from the real signal path.
- Find the delay again every time you move the mic. The phase and coherence only read correctly with the right delay compensation.
- Watch coherence before you trust a trace. Turn on Blank coherence below (for example 50%) to hide unreliable data, especially when you measure with programme material.
- Use more averages for decisions. 16 or more averages give a steady trace for capturing. Fewer averages react faster while you adjust things.
- Measure with show music. The transfer function works with any broadband signal, so during sound check or the show you can keep measuring with programme as the source, without playing noise.
- Limit the noise for subs. In Generator options, set Limit the noise to a band to about 30–200 Hz when you measure subs. The energy goes where the subs work, and the rest of the system is spared.
- Check the live impulse for polarity. A negative main peak means the polarity is inverted somewhere. Fix that before you judge a crossover.
- Track delays outdoors. Temperature and wind change arrival times. Turn on Track for the measurement and set the Air temperature in the delay calculator.
- Keep an eye on Dropouts. If the status bar shows dropouts, choose a larger Block size in Audio settings.
- Practise first. The demo system processor responds just like a real one. Try every tool there before the doors open.
Troubleshooting
| Symptom | Cause | Fix |
|---|---|---|
| No audio devices are listed | The interface is not connected or is in use by another program | Press Rescan devices. Close other audio programs. On Windows, try a different driver type. |
| The interface doesn't appear on Windows | No ASIO driver is installed | Install the manufacturer's ASIO driver, or use the interface's WASAPI entry. |
| Mac: inputs show no signal | Microphone access was not granted | System Settings > Privacy & Security > Microphone: allow Pi System Align. |
| "No clear arrival found" | The generator is off, no outputs are selected, the mic has no signal or the reference doesn't carry the generator | Turn on the generator (G), choose its Outputs, check the mic input meter and check that the reference carries the signal. |
| "The generator has no outputs selected" | No outputs are ticked under Outputs | Open Outputs and tick the outputs that feed the system. |
| Outputs shows "Start audio to choose outputs" | Audio is stopped | Press Start audio first. |
| Phase is a mess and coherence is low | The delay was not found, or the mic is in a null or reflection | Press D. Move the mic half a metre to a metre and try again. |
| The trace reads far too low before Find delay | The delay compensation is not set yet | Press D. The scale fits itself once the delay is found. |
| Peak shown as negative after Find delay | Polarity is inverted somewhere in the path | Check the cabling and processor polarity before aligning. |
| Calibration warns that the tone is not at 1 kHz | The calibrator is off or not seated properly | Re-seat the calibrator and measure again. |
| Calibration warns of clipping | The preamp gain is too high | Lower the gain and calibrate again. |
| SPL meter shows dBFS | The input is not calibrated | Calibrate it with Calibrate.... |
| T20 or T30 shown in amber | The decay is not a straight line (noise or a short sweep) | Use a longer sweep, more averages or a quieter room. |
| Long sweep lengths are greyed out | The sweep doesn't fit the audio buffer at this sample rate | Choose a shorter sweep. |
| Crossover alignment: "Both sources need data" | A live source has no data or the traces are missing | Start audio for live sources, or capture traces of both. |
| Apply to trace: "That source is a live measurement" | Changes can only be applied to captured traces | Apply the change in your processor and measure again. |
| Sum or Average refuses | Spectrum and transfer traces are mixed, or a trace has no phase (for Sum) | Select traces of the same kind, with phase for a sum. |
| Dropouts appear in the status bar | The audio buffer is too small for the computer | Choose a larger Block size. |
| Buttons read Activate to save | Limited mode: no active licence or trial | Open Help > Licence... and activate, or start the trial. |
| Banner: the licence system is unavailable | The licence component is missing | Reinstall Pi System Align. |
Specifications & system requirements
Specifications
| Item | Specification |
|---|---|
| Current version | 1.1.0 |
| Measurements | Transfer function (MTW or fixed FFT 4096–65536), spectrum, impulse response, SPL |
| Alignment | Mic placement, crossover alignment, arrival times, delay calculator |
| Systems in the placement plan | Mains, subs, center fill, front fills, out fills, under balcony, delays |
| Traces | Capture, power/complex/dB average, complex sum, rename, edit, CSV import/export |
| Generator | Pink noise, pink periodic, white noise, sine, log sweep |
| Sample rates | 44.1, 48, 88.2, 96 kHz |
| Channels | Up to 64 inputs and 64 outputs |
| Spectrum banding | 1/1 to 1/48 octave, A/C/Z weighting |
| Room acoustics | EDT, T20, T30, C50, C80, D50, Ts; broadband and 63 Hz–8 kHz octaves |
| SPL | A/C/Z, Fast/Slow/Leq, max, peak, Leq 1/10/15 min, one-hour per-second history |
| File formats | Sessions .pisa; traces .csv/.txt/.frd; impulse responses .wav; licence .pilic |
| Audio drivers | Core Audio (macOS), ASIO and WASAPI (Windows) |
System requirements
macOS
| Minimum | Recommended | |
|---|---|---|
| OS | macOS 11 Big Sur | Latest macOS |
| Processor | Intel or Apple silicon | Apple silicon or recent Intel |
| Memory | 4 GB | 8 GB |
| Disk | 300 MB | 300 MB |
| Audio | 2-channel interface + measurement mic | Multichannel interface + calibrated omni mic |
Windows
| Minimum | Recommended | |
|---|---|---|
| OS | Windows 10 64-bit | Windows 11 64-bit |
| Processor | Intel / AMD, 64-bit, 2 cores | Intel Core i5 / AMD Ryzen 5 |
| Memory | 4 GB | 8 GB |
| Disk | 300 MB | 300 MB |
| Audio | 2-channel ASIO interface + measurement mic | Multichannel ASIO interface + calibrated omni mic |
Pi System Align works with Core Audio interfaces on macOS, ASIO interfaces on Windows, USB digital consoles, and MADI or network audio cards through their drivers. The built-in demo system needs no interface. Linux is not supported.
Support
- Email: support@pi-ware.com
- Website: www.pi-ware.com (downloads, your licences and the account page)
- Tutorials: youtube.com/@pibysaharty
When you contact support, include your version number (Help > About Pi System Align by Saharty), your operating system and your audio interface.
Pi System Align by Saharty. © 2026 Pi by Saharty.